Plotly has a nice way of making click-events available to the calling language, but
it doesn’t quite work simply when using subplot(). This isn’t a post about a new
feature, but I didn’t quickly find a resource for it so I’ll add my findings to
make it easier for the next person.
Plotly (as a graphics library) is a JavaScript library that has been ported to R, Python, Julia, and - surprising to me - MATLAB and F#. It provides an interactive plotting framework that works really nicely for web-facing apps including R’s {shiny}.
I’m currently building an internal tool at work and wanted to add some click-event-based
reactivity. Plotly supports that by registering an ‘event’ with a ‘source’ which
can be listened to with an event_data() call. A simple shiny app demonstrating that
might be
library(plotly)
library(shiny)

ui <- basicPage("",
                mainPanel(
                  plotlyOutput("p"),
                  verbatimTextOutput("out")
                )
)

server <- function(input, output, session) {
  output$p <- renderPlotly({
    plotly::plot_ly(data = mtcars,
                    y = ~ hp,
                    x = ~ mpg,
                    type = "scatter",
                    mode = "markers",
                    source = "click_src") |> # default is "A"
      event_register("plotly_click")
  })

  output$out <- renderPrint({
    click_data <- event_data("plotly_click", source = "click_src")
    req(click_data)
    message("CLICK!")
    click_data
  })
}

runApp(shinyApp(ui = ui, server = server))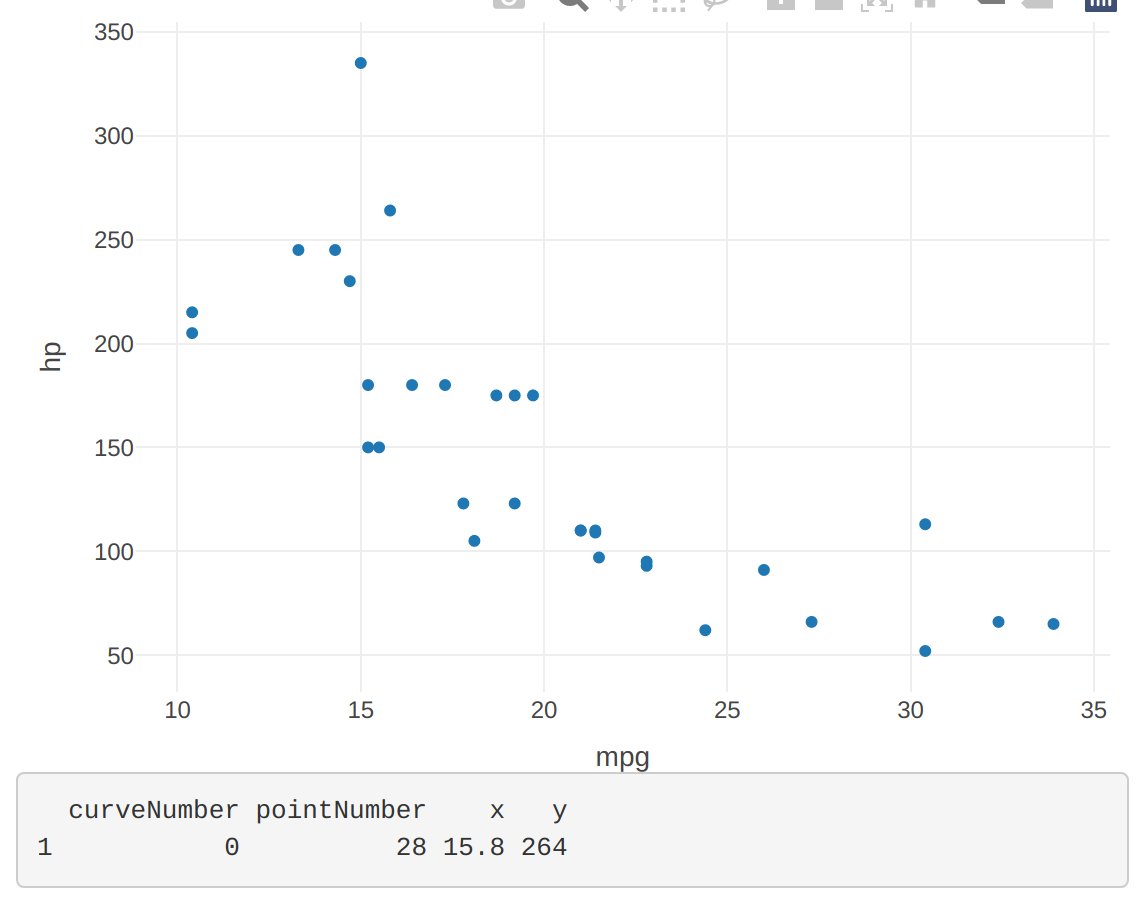
There’s a bit to break down here if you’re not familiar with {shiny};
- A user interface stored as
uiwhich describes how the app should “look”. In this extremely simple case, it’s someplotlyoutput followed by some text. - A server function which performs the ‘backend’ operations, sending outputs to the components
corresponding to the UI elements. In this case producing a
plotlyplot of themtcarsdataset with a ‘scatter’ plot of thehpcolumn on the y-axis and thempgcolumn on the x-axis. Thesourceargument specifies a ‘label’ for the event (defaulting to"A"but specified as"click_src"in this case). Finally, the ‘event’ is registered. This example also includes a text output of the data associated with clicking on a point in the plot, and a message the console every time that happens. - A call to
runApp()which starts an app with the specifieduiandserver.
This generates a simple shiny app with one plot. Clicking on any of the points produces a text output containing:
curveNumber: identifying the ‘trace’ number for that data. We only have one, so this will always be0(JavaScript starts counting at 0)pointNumber: ostensibly the index of the clicked point in the original dataset, though I believe that may not always be the casexthe x-coordinate of the clicked pointythe y-coordinate of the clicked point
This is nice for interacting with the plot to, say, highlight a row in a table
containing the same data. With two of these plots side-by-side one can give each
a unique source and “listen” to those independently.
If, however, we have several plots and want them to share a common x-axis (so that
panning works across all of the plots) we need to “combine” the plots using
plotly::subplot(). This doesn’t take a source argument itself, and when we provide a
list of several plots, it produces a warning that
Warning: Can only have one: sourceHow, then, do we identify which subplot was clicked?
If each subplot contained a single “trace”, then curveNumber would correspond
to that trace (in the order they were supplied to subplot) and we could identify
which subplot was clicked. A small example of the server code
(the UI would be the same) for such a setup might be
server <- function(input, output, session) {
  output$p <- renderPlotly({
    p1 <- plotly::plot_ly(data = mtcars,
                          y = ~ hp,
                          x = ~ mpg,
                          type = "scatter",
                          mode = "markers")

    p2 <- plotly::plot_ly(data = mtcars,
                          y = ~ wt,
                          x = ~ mpg,
                          type = "scatter",
                          mode = "markers")

    p3 <- plotly::plot_ly(data = mtcars,
                          y = ~ disp,
                          x = ~ mpg,
                          type = "scatter",
                          mode = "markers")

    s <- plotly::subplot(
      list(p1, p2, p3),
      shareX = TRUE,
      nrows = 3,
      heights = c(1, 1, 1)/3
    ) |>
      event_register("plotly_click")
    s$x$source <- "click_src" # subplot does not take a `source` argument
    s
  })

  output$out <- renderPrint({
    click_data <- event_data("plotly_click", source = "click_src")
    req(click_data)
    message("CLICK!")
    click_data
  })
}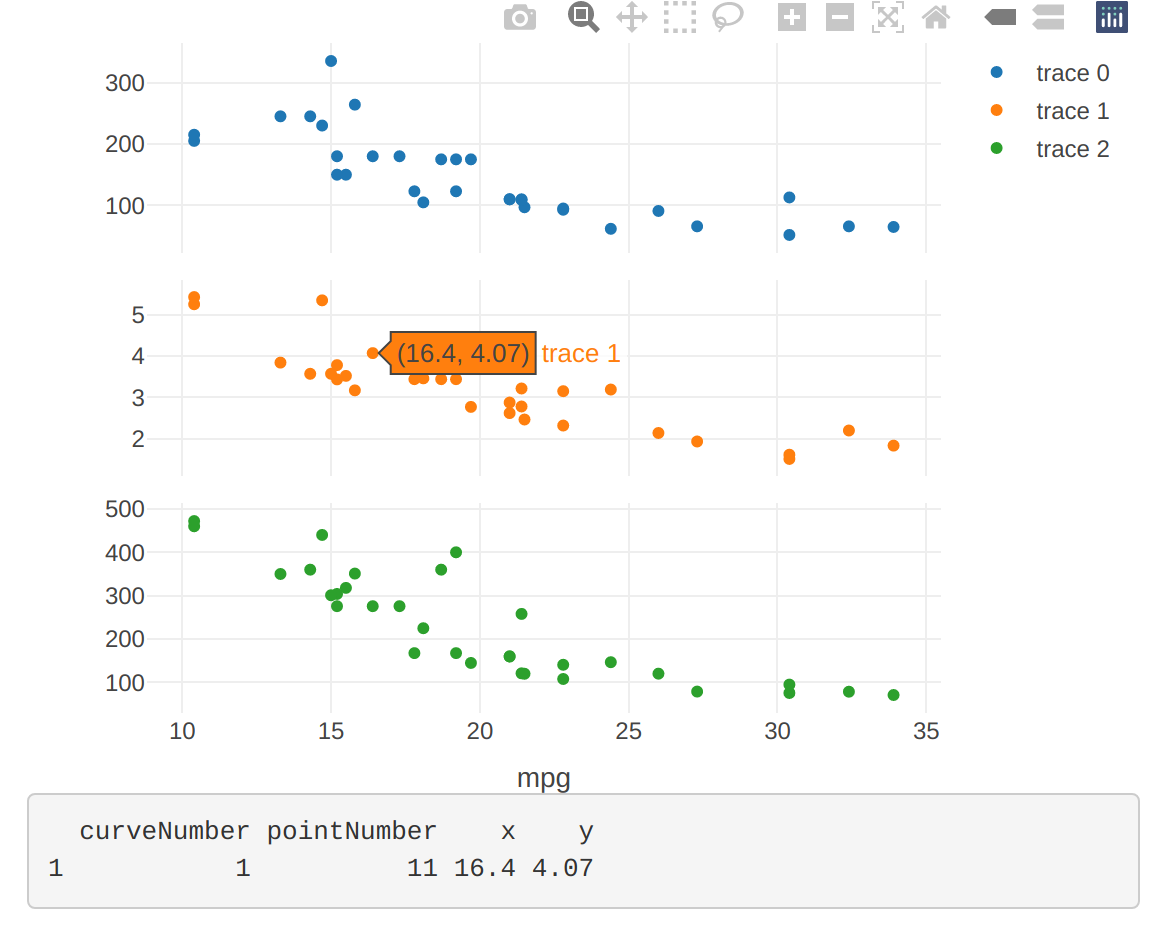
Because subplot doesn’t take a source argument, the (single) source needs
to be added into the resulting object by force with the s$x$source line. This works,
and we can get click data back from each subplot. In theory, curveNumber identifies
which subplot was clicked.
However, if a subplot contained multiple traces (as my actual example did - a difficult to count number of traces that was updated as the underlying data changed… each different ‘color’ point you plot is a unique trace) then this gets complicated.
A minor update to the server, adding one additional “markers” trace to the second plot…
    p2 <- plotly::plot_ly(data = mtcars,
                          y = ~ wt,
                          x = ~ mpg,
                          type = "scatter",
                          mode = "markers") |>
      add_markers(y = ~ drat)                   # <- an additional trace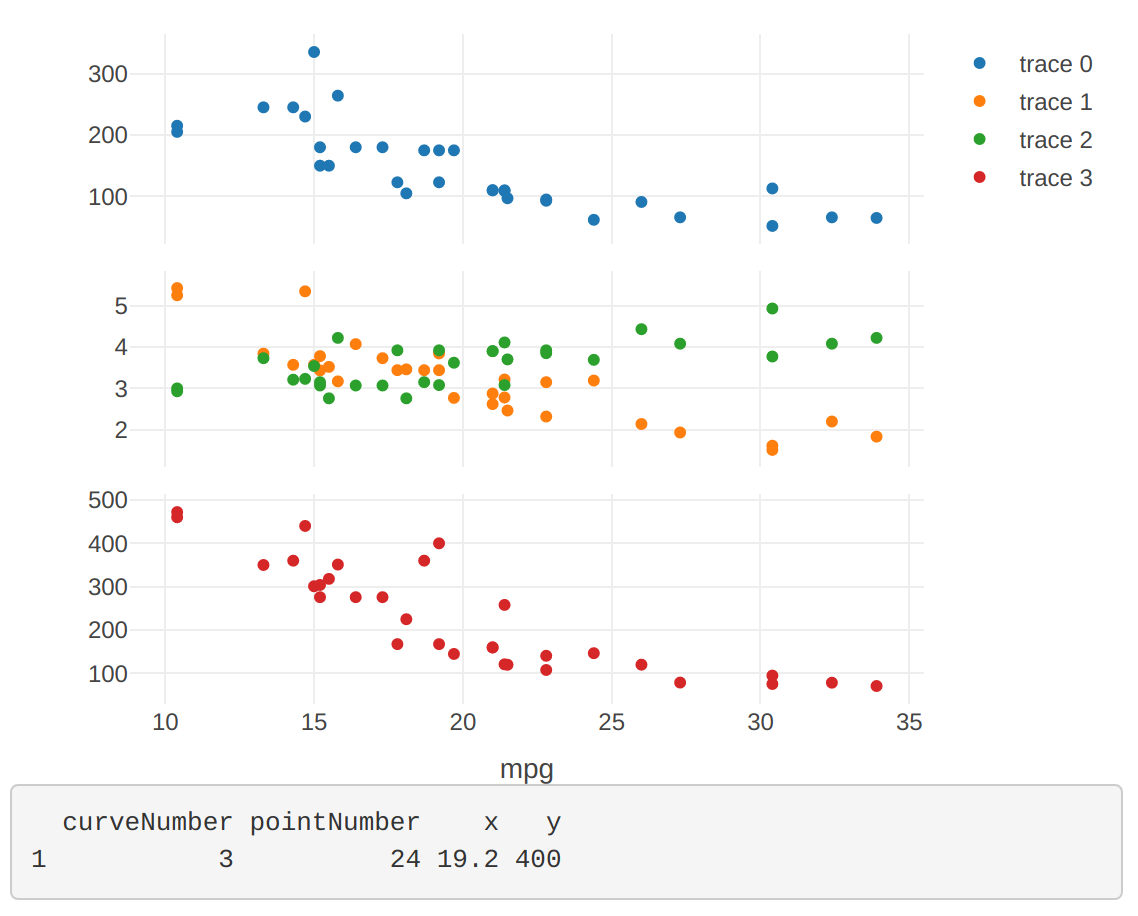
curveNumber aloneSo, how can we identify the subplot when we can’t count the traces? The solution
appears to be to add another entry to the click-data using customdata…
server <- function(input, output, session) {
  output$p <- renderPlotly({
    p1 <- plotly::plot_ly(data = mtcars,
                          y = ~ hp,
                          x = ~ mpg,
                          type = "scatter",
                          mode = "markers",
                          customdata = "first_plot")       # <--

    p2 <- plotly::plot_ly(data = mtcars,
                          y = ~ wt,
                          x = ~ mpg,
                          type = "scatter",
                          mode = "markers",
                          customdata = "second_plot") |>   # <--
      add_markers(y = ~ drat, customdata = "second_plot")  # <--

    p3 <- plotly::plot_ly(data = mtcars,
                          y = ~ disp,
                          x = ~ mpg,
                          type = "scatter",
                          mode = "markers",
                          customdata = "third_plot")       # <--

    s <- plotly::subplot(
      list(p1, p2, p3),
      shareX = TRUE,
      nrows = 3,
      heights = c(1, 1, 1)/3
    ) |>
      event_register("plotly_click")
    s$x$source <- "click_src"
    s
  })

  output$out <- renderPrint({
    click_data <- event_data("plotly_click", source = "click_src")
    req(click_data)
    message("CLICK!")
    click_data
  })
}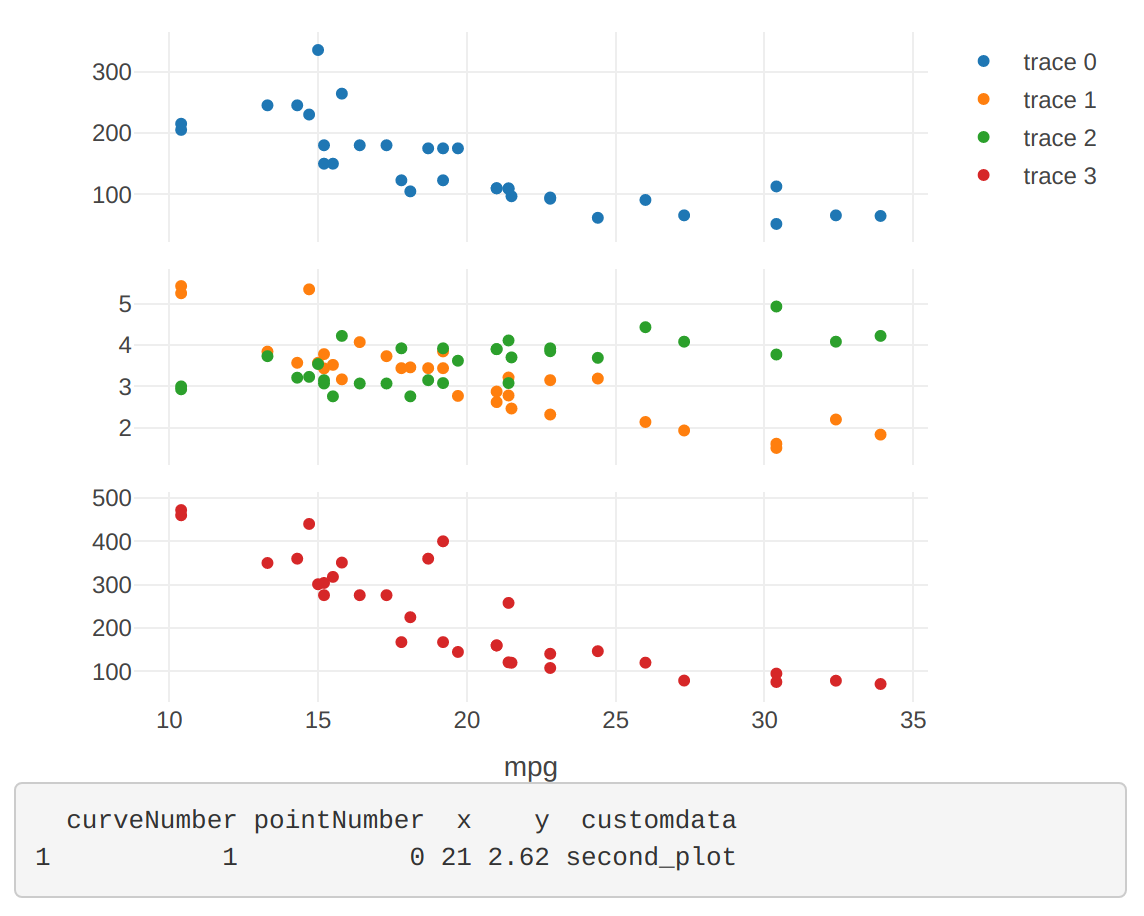
customdata it’s easy to determine which plot was clickedIn this example I’ve added a single customdata value to each plot so it will be
recycled across all of the data points in each plot. I’ve also added the same
"second_plot" value to both of the traces in the second plot, but you could
further distinguish those if desired. You can also add a vector of customdata
(one value per point, in order) to individually identify the records, such as a key
value to deterministically reproduce the pointNumber functionality.
As a final check (after doing all the old-school research myself) I asked an AI
how to identify which plot was clicked and it more or less gave the answers I’ve
described here, with some (different) example code and all. It took a bit of
prompting to get it to go further than just using the curveNumber but I was amazed
that it really did produce a (more or less) working proof-of-concept with minimal
refinement. I definitely need to jump straight to that more often instead of fiddling
around with solutions that don’t work for too long.
Is there a better way to achieve this? Let me know! I’m pretty much not on the bird site any more but I can be found on Mastodon or use the comments below.
devtools::session_info()
## ─ Session info ───────────────────────────────────────────────────────────────
##  setting  value
##  version  R version 4.1.2 (2021-11-01)
##  os       Pop!_OS 22.04 LTS
##  system   x86_64, linux-gnu
##  ui       X11
##  language (EN)
##  collate  en_AU.UTF-8
##  ctype    en_AU.UTF-8
##  tz       Australia/Adelaide
##  date     2023-06-17
##  pandoc   3.1.1 @ /usr/lib/rstudio/resources/app/bin/quarto/bin/tools/ (via rmarkdown)
##
## ─ Packages ───────────────────────────────────────────────────────────────────
##  package     * version date (UTC) lib source
##  blogdown      1.17    2023-05-16 [1] CRAN (R 4.1.2)
##  bookdown      0.29    2022-09-12 [1] CRAN (R 4.1.2)
##  bslib         0.4.1   2022-11-02 [3] CRAN (R 4.2.2)
##  cachem        1.0.6   2021-08-19 [3] CRAN (R 4.2.0)
##  callr         3.7.3   2022-11-02 [3] CRAN (R 4.2.2)
##  cli           3.4.1   2022-09-23 [3] CRAN (R 4.2.1)
##  crayon        1.5.2   2022-09-29 [3] CRAN (R 4.2.1)
##  devtools      2.4.5   2022-10-11 [1] CRAN (R 4.1.2)
##  digest        0.6.30  2022-10-18 [3] CRAN (R 4.2.1)
##  ellipsis      0.3.2   2021-04-29 [3] CRAN (R 4.1.1)
##  evaluate      0.18    2022-11-07 [3] CRAN (R 4.2.2)
##  fastmap       1.1.0   2021-01-25 [3] CRAN (R 4.2.0)
##  fs            1.5.2   2021-12-08 [3] CRAN (R 4.1.2)
##  glue          1.6.2   2022-02-24 [3] CRAN (R 4.2.0)
##  htmltools     0.5.3   2022-07-18 [3] CRAN (R 4.2.1)
##  htmlwidgets   1.5.4   2021-09-08 [1] CRAN (R 4.1.2)
##  httpuv        1.6.6   2022-09-08 [1] CRAN (R 4.1.2)
##  jquerylib     0.1.4   2021-04-26 [3] CRAN (R 4.1.2)
##  jsonlite      1.8.3   2022-10-21 [3] CRAN (R 4.2.1)
##  knitr         1.40    2022-08-24 [3] CRAN (R 4.2.1)
##  later         1.3.0   2021-08-18 [1] CRAN (R 4.1.2)
##  lifecycle     1.0.3   2022-10-07 [3] CRAN (R 4.2.1)
##  magrittr      2.0.3   2022-03-30 [3] CRAN (R 4.2.0)
##  memoise       2.0.1   2021-11-26 [3] CRAN (R 4.2.0)
##  mime          0.12    2021-09-28 [3] CRAN (R 4.2.0)
##  miniUI        0.1.1.1 2018-05-18 [1] CRAN (R 4.1.2)
##  pkgbuild      1.4.0   2022-11-27 [1] CRAN (R 4.1.2)
##  pkgload       1.3.0   2022-06-27 [1] CRAN (R 4.1.2)
##  prettyunits   1.1.1   2020-01-24 [3] CRAN (R 4.0.1)
##  processx      3.8.0   2022-10-26 [3] CRAN (R 4.2.1)
##  profvis       0.3.7   2020-11-02 [1] CRAN (R 4.1.2)
##  promises      1.2.0.1 2021-02-11 [1] CRAN (R 4.1.2)
##  ps            1.7.2   2022-10-26 [3] CRAN (R 4.2.2)
##  purrr         1.0.1   2023-01-10 [1] CRAN (R 4.1.2)
##  R6            2.5.1   2021-08-19 [3] CRAN (R 4.2.0)
##  Rcpp          1.0.9   2022-07-08 [1] CRAN (R 4.1.2)
##  remotes       2.4.2   2021-11-30 [1] CRAN (R 4.1.2)
##  rlang         1.0.6   2022-09-24 [1] CRAN (R 4.1.2)
##  rmarkdown     2.18    2022-11-09 [3] CRAN (R 4.2.2)
##  rstudioapi    0.14    2022-08-22 [3] CRAN (R 4.2.1)
##  sass          0.4.2   2022-07-16 [3] CRAN (R 4.2.1)
##  sessioninfo   1.2.2   2021-12-06 [1] CRAN (R 4.1.2)
##  shiny         1.7.2   2022-07-19 [1] CRAN (R 4.1.2)
##  stringi       1.7.8   2022-07-11 [3] CRAN (R 4.2.1)
##  stringr       1.5.0   2022-12-02 [1] CRAN (R 4.1.2)
##  urlchecker    1.0.1   2021-11-30 [1] CRAN (R 4.1.2)
##  usethis       2.1.6   2022-05-25 [1] CRAN (R 4.1.2)
##  vctrs         0.5.2   2023-01-23 [1] CRAN (R 4.1.2)
##  xfun          0.34    2022-10-18 [3] CRAN (R 4.2.1)
##  xtable        1.8-4   2019-04-21 [1] CRAN (R 4.1.2)
##  yaml          2.3.6   2022-10-18 [3] CRAN (R 4.2.1)
##
##  [1] /home/jono/R/x86_64-pc-linux-gnu-library/4.1
##  [2] /usr/local/lib/R/site-library
##  [3] /usr/lib/R/site-library
##  [4] /usr/lib/R/library
##
## ──────────────────────────────────────────────────────────────────────────────