My name is Jonathan, and I have a coding obsession.
[Read More]52vis Week 2 Challenge -- Australian Version
I mapped out the USA homelessness rate in my last post as a challenge and noted at the end that it would be interesting to do the same for Australia. That was the first comment I received in person, too. “Let’s do it!” I said. What I found may shock you (click-bait title; check).
[Read More]52vis Week 2 Challenge
From Bob Rudis’ blog comes a weekly data/coding challenge. I didn’t quite get the time to tackle last week’s but I thought this one offered up a pretty good opportunity.
[Read More]Bring on the ROpenSci #auunconf 2016!
I’ll be heading to the 2016 ROpenSci un-conference (hackathon) in Brisbane later this month to smash out a heap of open-science R code. Ideas are already flowing quite nicely, and I’m confident that any ideas we don’t end up officially working on will get their chance in the very near future.
[Read More]Image marginal histograms
Another day, another interesting challenge.
[Read More]Is it crowded in here?
This was a neat graphic that someone made. It shows the population at a given latitude or longitude as a bar chart, overlayed on a map of the world itself. It shows where people live; the bigger the bar, the more people living at that latitude/longitude.
[Read More]Jackpot!
The powerball lottery in the USA has jackpotted to a first prize of $1.3 billion, which is just a silly amount of money.
[Read More]SimplyStats Thanksgiving Puzzle
I owe a lot to Jeff Leek and Roger Peng for their great Coursera courses, in which I learned to program in R.
[Read More]What are the odds?
[ Trigger warning: this post contains maths. Please don’t be afraid, it probably won’t bite. ]
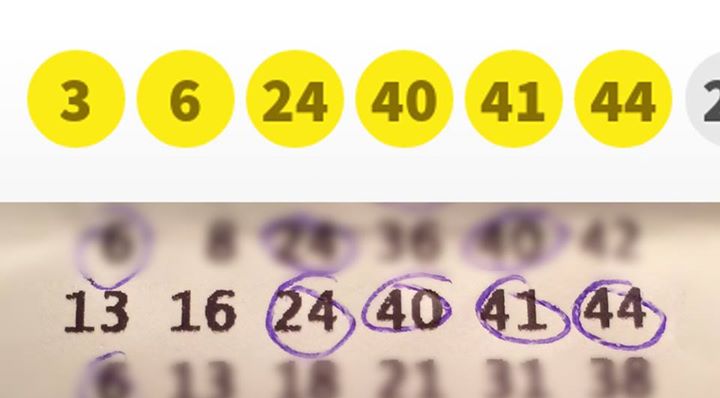
After posting this photo of our lottery ticket to Facebook

I thought more and more about random-event probabilities.
[Read More]Project Euler Q5 :: Smallest multiple
Explanation. Standard caveat: don’t look here if you are trying to do these yourself.
[Read More]